Yield · Climate · Resources
How can we produce sufficient food, within the planetary boundaries?
The REAP atlas will bring together data on crop productivity, resource use and efficiency, and climate change effects: locally relevant, globally consistent.
What’s in the atlas
REAP in a nutshell
REAP will be a global database with local case studies on farmers’ actual performance, environmental pressures and socio-economic context.
The Global Yield Gap Atlas (GYGA) provided relevant productivity benchmarks, but more aspects of crop production need attention. REAP builds on that work and adds resource use, climate change and local insight. The atlas is scheduled to be launched in March.
01
Crop productivity
Yield levels and yield gaps, indicating the scope for increasing food production.
02
Climate change
Short- and long-term projections of climate change effects on potential and water-limited yield.
03
Resource use
How much water and nutrients are needed and used to produce our food, revealing underutilisation or oversupply of inputs.
04
Local case studies
Deeper insight in production and resource use efficiency constraints, and lessons from the best farmers.
The yield gap
Benchmarking what farms produce against what they could.
REAP will apply the yield gap concept to determine productivity levels and yield gaps. The difference between the potential and the yield farmers achieve is the yield gap: the unrealised crop production on existing cropland.
Yp
Potential yield under optimal crop management
Yw
Water-limited yield, considering drought stress
Ya
Actual yield that farmers achieve on their farm
Who REAP is for
Policymakers
Set realistic and scientific-based targets for future food availability and natural resource use.
Funders & development partners
Know where your investment makes the most impact.
Agri-companies & consultants
Pinpoint regions to produce or source more, and sustainably.
Researchers
Obtain consistent data for crops, countries, climates.
Example from the map viewer
Sample data
Kenya · rainfed maize
Current climate
Key figures
| Potential yield (Yp) | 11.7 t/ha |
| Water-limited yield (Yw) | 9.1 t/ha |
| Actual yield (Ya) | 1.9 t/ha |
| Yield gap (Yw − Ya) | 7.2 t/ha |
| Minimum N for 80% of Yw | 145 kg N/ha |
The concept
Three lenses on sustainable production
Production levels
Room to grow
Yield levels (Yp, Yw, Ya) and yield gaps show the scope for increasing food production on existing cropland.
Climate change
Future yields
Climate change projections will show potential and water-limited production in the near future (2050 to 2060) and far future (2080 to 2090).
Resource use
Safe limits
Minimum input requirements for different yields will be established, and actual resource use efficiency benchmarked against a safe operating space.
Examples
What REAP can reveal
Production · Africa
25→50%
Can Africa feed itself?
Cereal yields must rise from about a quarter to half of their potential by 2050.
Van Ittersum et al., 2025
Climate · Africa
+ / −
Winners and losers
Grain legumes gain on average from climate change, while cereals lose.
Van Loon et al., 2026, Global Food Security 50
Nitrogen · Global
15×
Too little, too much
African maize needs far more nitrogen; European potatoes can do with less.
Ten Berge et al., 2019
Case study
Local
[Case study title]
Learning from the best farmers how sufficient food can be produced with minimum environmental impact.
Ravensbergen et al., 2024
The atlas
From the global map to the numbers for one country
The REAP atlas is an online map viewer. Choose a crop, an indicator and a climate scenario, then click a country to see its yield potential, actual yield and yield gap, with the data sources behind them.
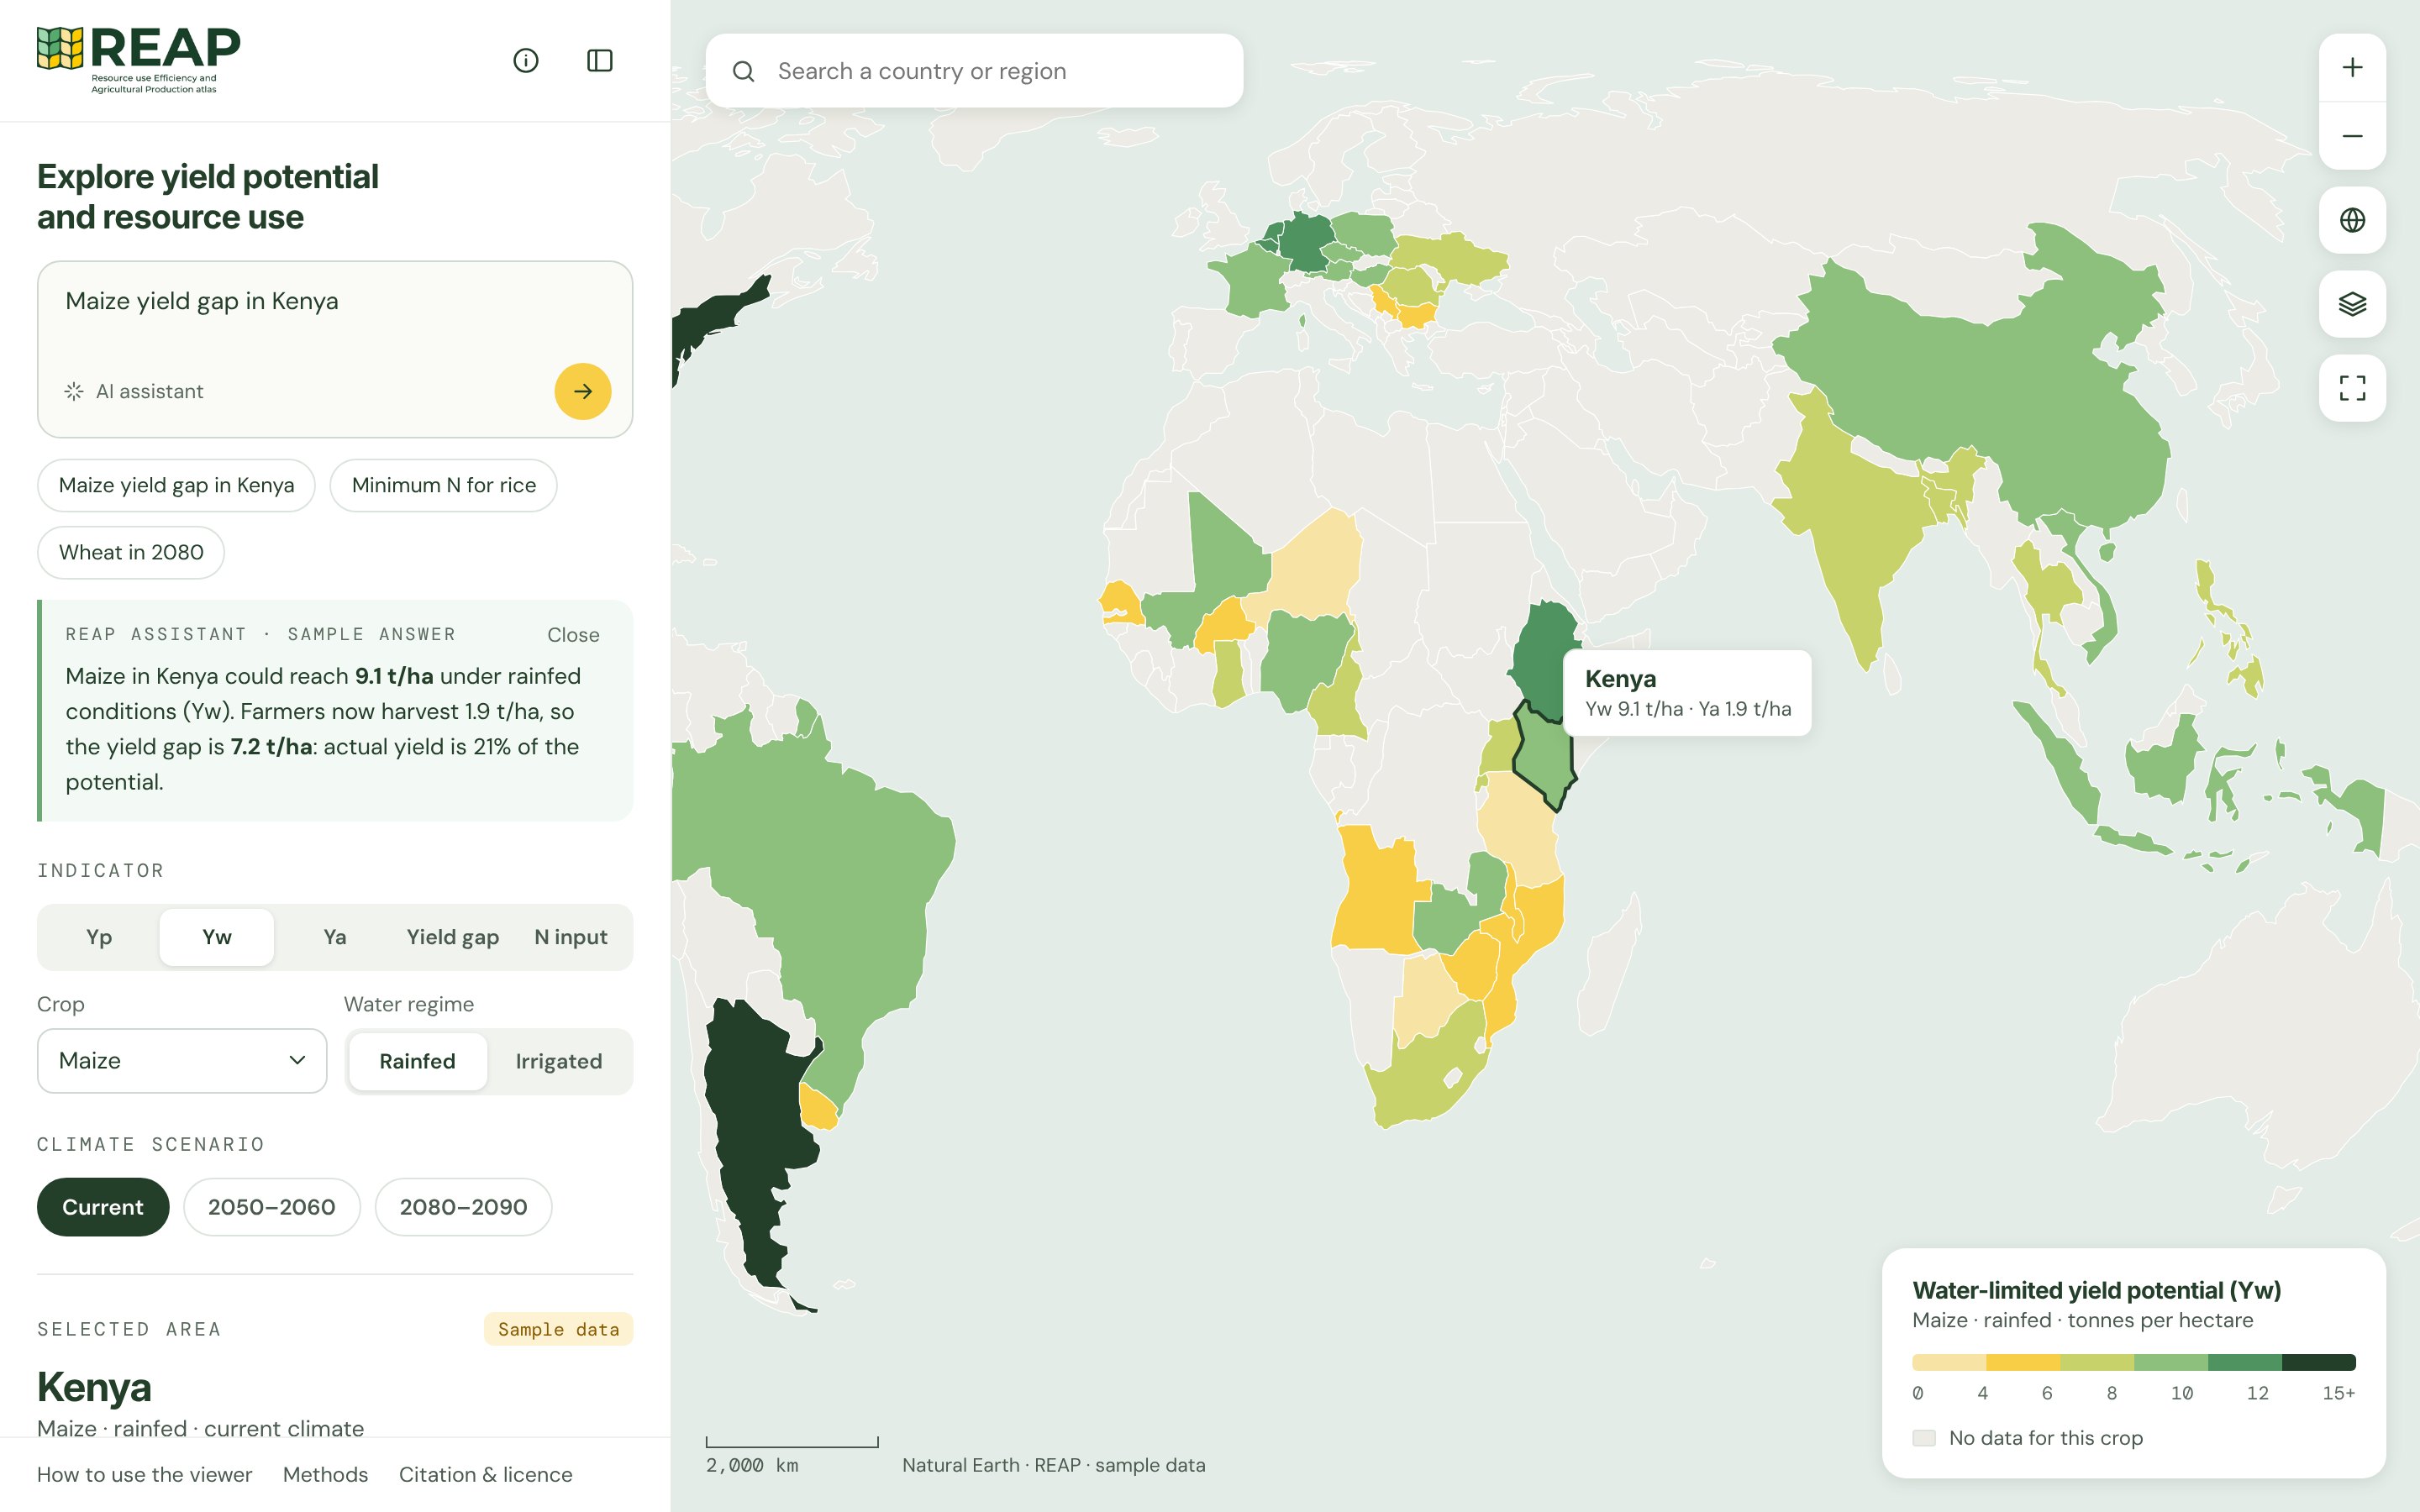
Prototype with sample data. Final design and data may differ.
Five indicators
Potential yield (Yp), water-limited yield (Yw), actual yield (Ya), the yield gap and the minimum nitrogen needed.
Crops and water
Major food crops, rainfed and irrigated. For two-season countries such as Kenya: early and late maize.
Today and future climate
Compare the current climate with 2050–2060 and 2080–2090, per country and climate zone.
Ask, compare, download
Ask questions in plain language, open country details and download tables and maps under CC BY-NC-SA 4.0.
Collaborate with REAP
There are many ways to engage – pick what fits your goals
Data
Local data makes REAP better for everyone. Your local agronomic data strengthens the picture for your region.
Use cases
Bring a real question on food security, climate adaptation, input policy. Together we will explore how REAP can add value.
Expertise
Contribute expertise, methods, or models and become part of the network shaping the future of agri-data.
Finance
Commission analysis built on REAP data or bring REAP to a new region, country, or crop. You get tailored insights, REAP grows its global coverage.
The next step for GYGA
Continuing the Global Yield Gap Atlas
REAP is the next step for the Global Yield Gap Atlas (GYGA) at Wageningen University & Research. It carries forward GYGA’s local-to-global method for estimating yield potential and yield gaps, relied on by public and private data users worldwide, and extends it with resource use, climate change and local case studies.
REAP is a project of
